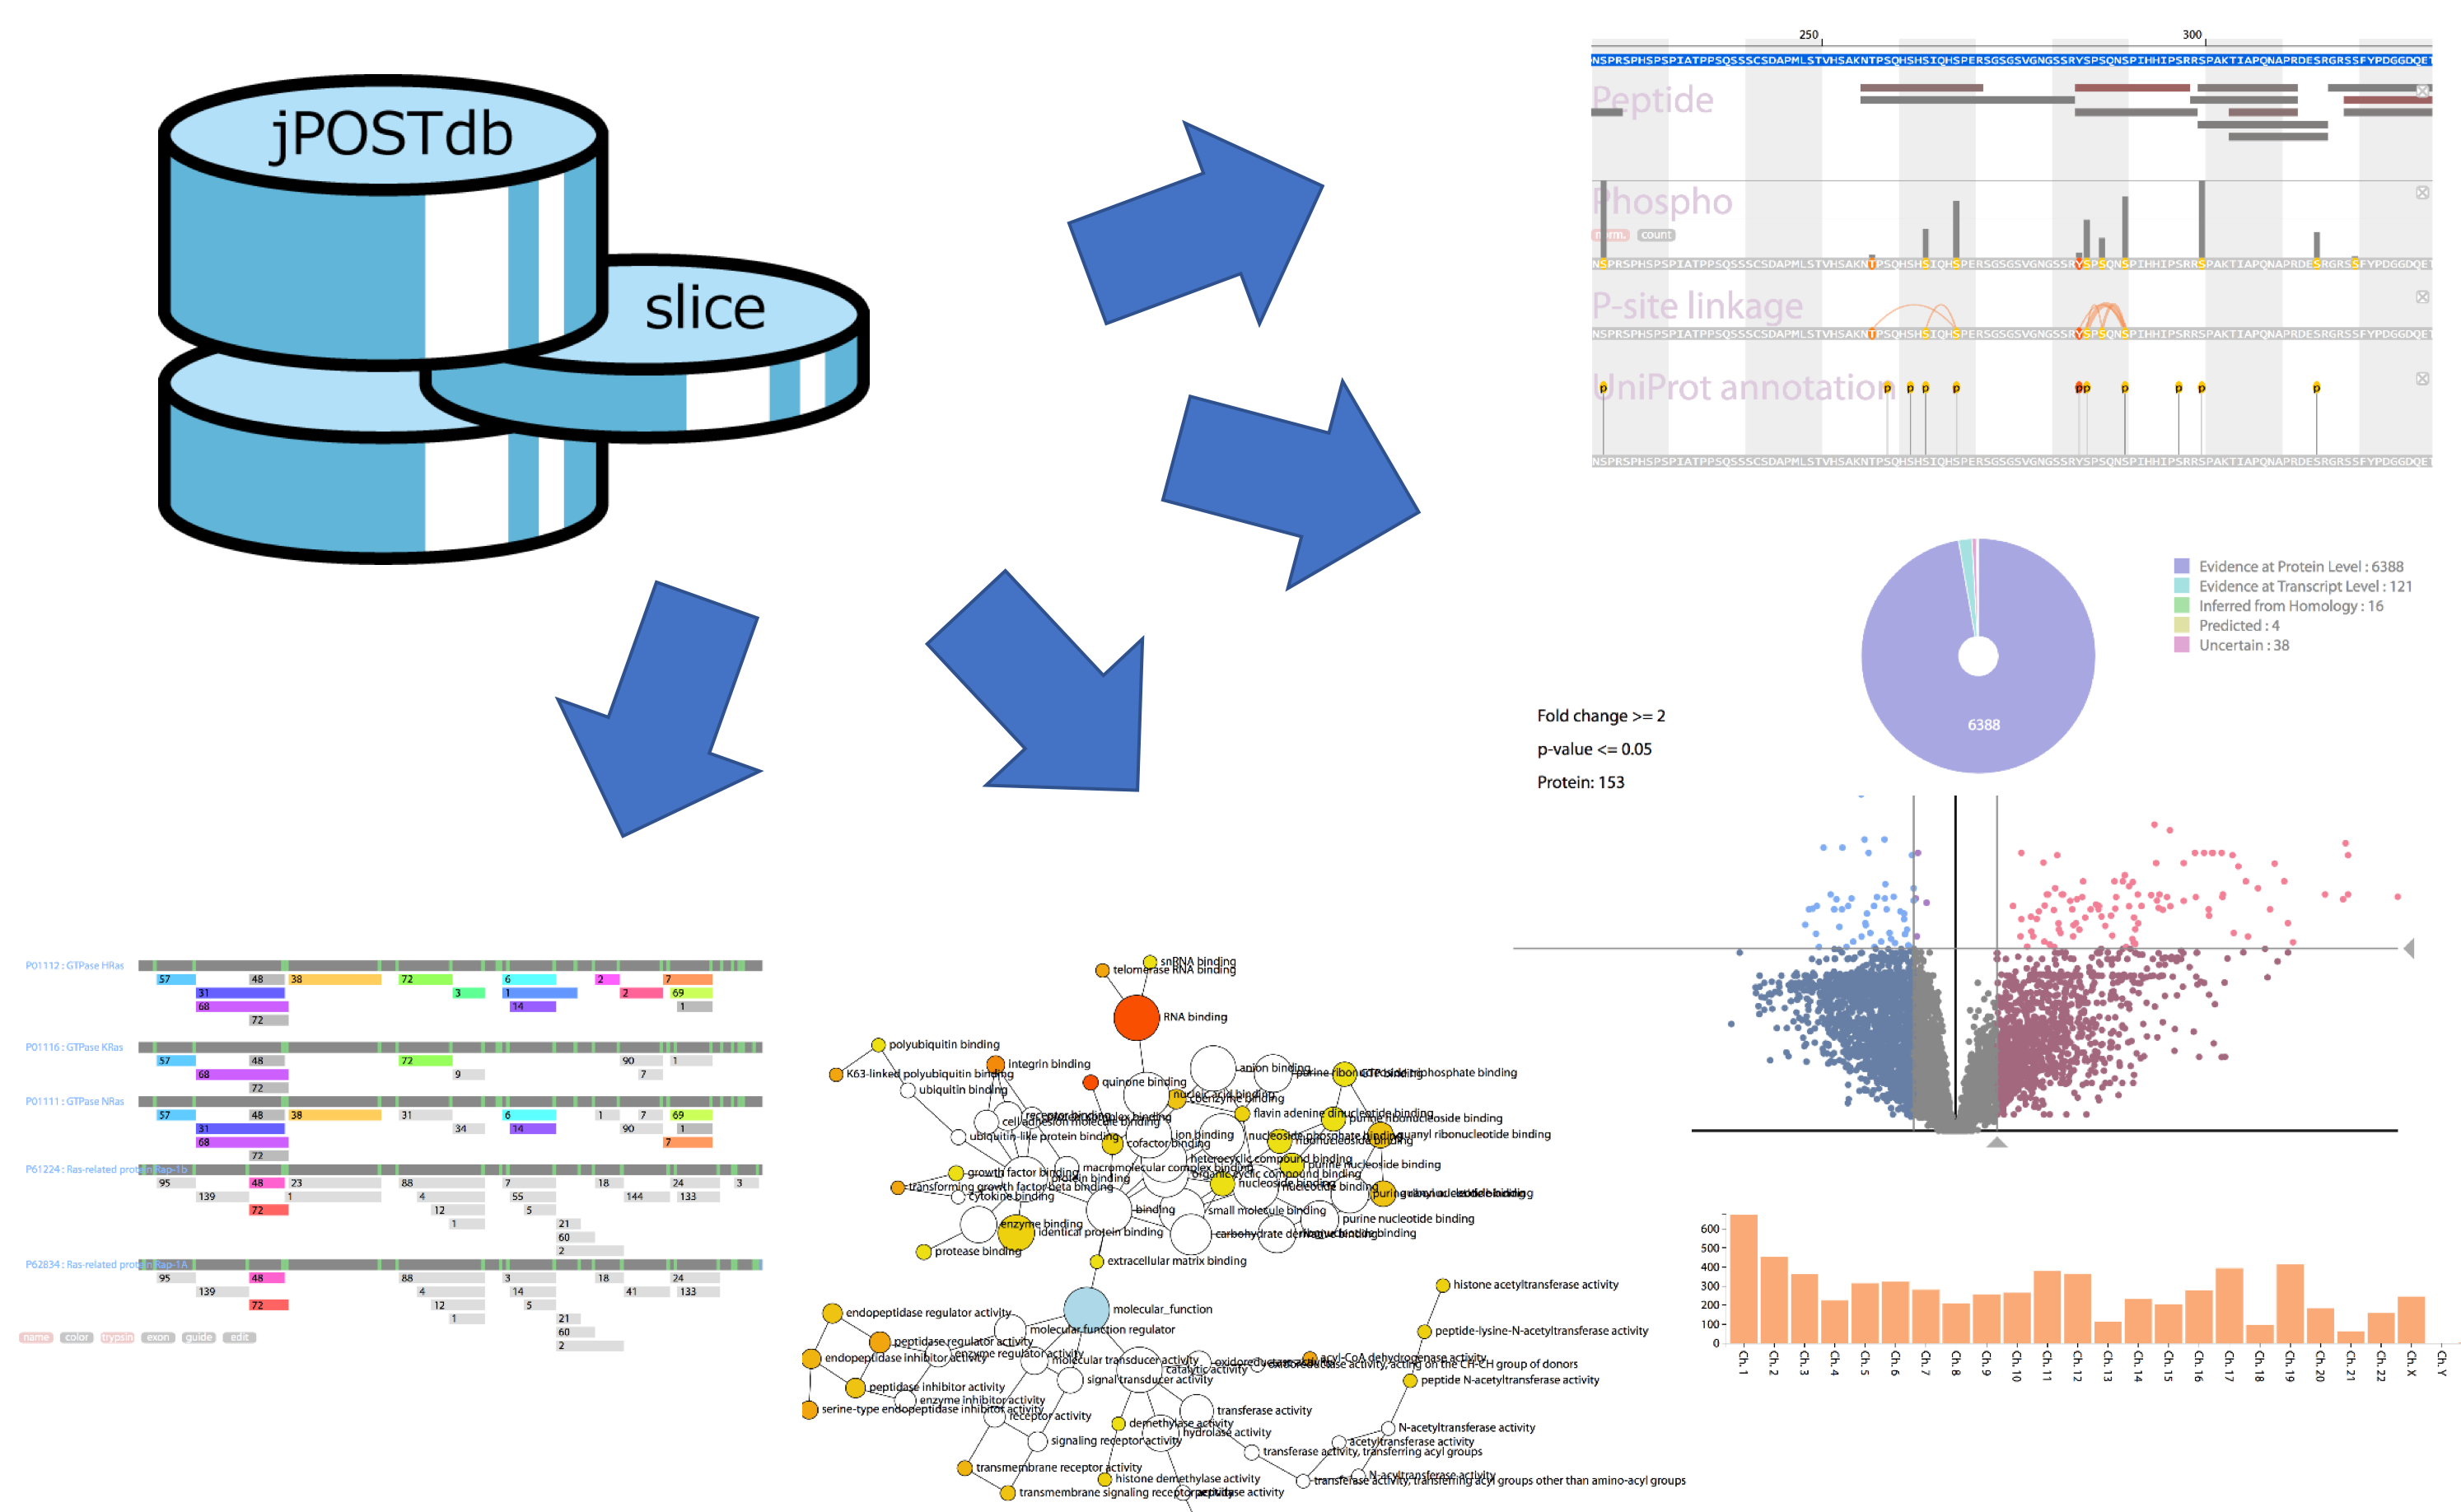
jPOSTdb (Japan ProteOme STandard DataBase) is a database containing re-analysis results with unified criteria for proteome data from jPOSTrepo. It provides viewers showing the frequency of detected post-translational modifications, the co-occurrence of phosphorylation sites on a peptide and peptide sharing among proteoforms.
Slice1:
Slice2:
What is "jPOSTdb"?
- The jPOSTdb is a database containing re-analysis results with unified criteria for raw data from jPOSTrepo and other ProteomeXchange (PX) repositories.
- It provides following functions:
-
- Dataset filtering by metadata
- Browsing of identified peptides, post-translational modifications (PTMs), and other data
- Creation and comparison of "Slice";, which is dataset(s) filtered by a user
- Basic statistical analysis and visualization of a specified "Slice";
- The jPOSTdb stores Peptide Spectrum Match (PSM) information and identified peptide information for each dataset.
- Proteins are inferred based on these information by using the method proposed by Nesvizhskii, A.I. et al. 2005 (doi:10.1074/mcp.R500012-MCP200)
- The jPOST database used the UniProt Reference Proteome dataset (with additional.fasta file) for peptide identification.
- The information such as datasets, inferred proteins, identified peptides, and PSMs is hierarchically stored in the jPOST database. The whole dataset union is named "Globe" and the retrieved partial datasets filtered from the Globe is named "Slice."
How to use jPOSTdb
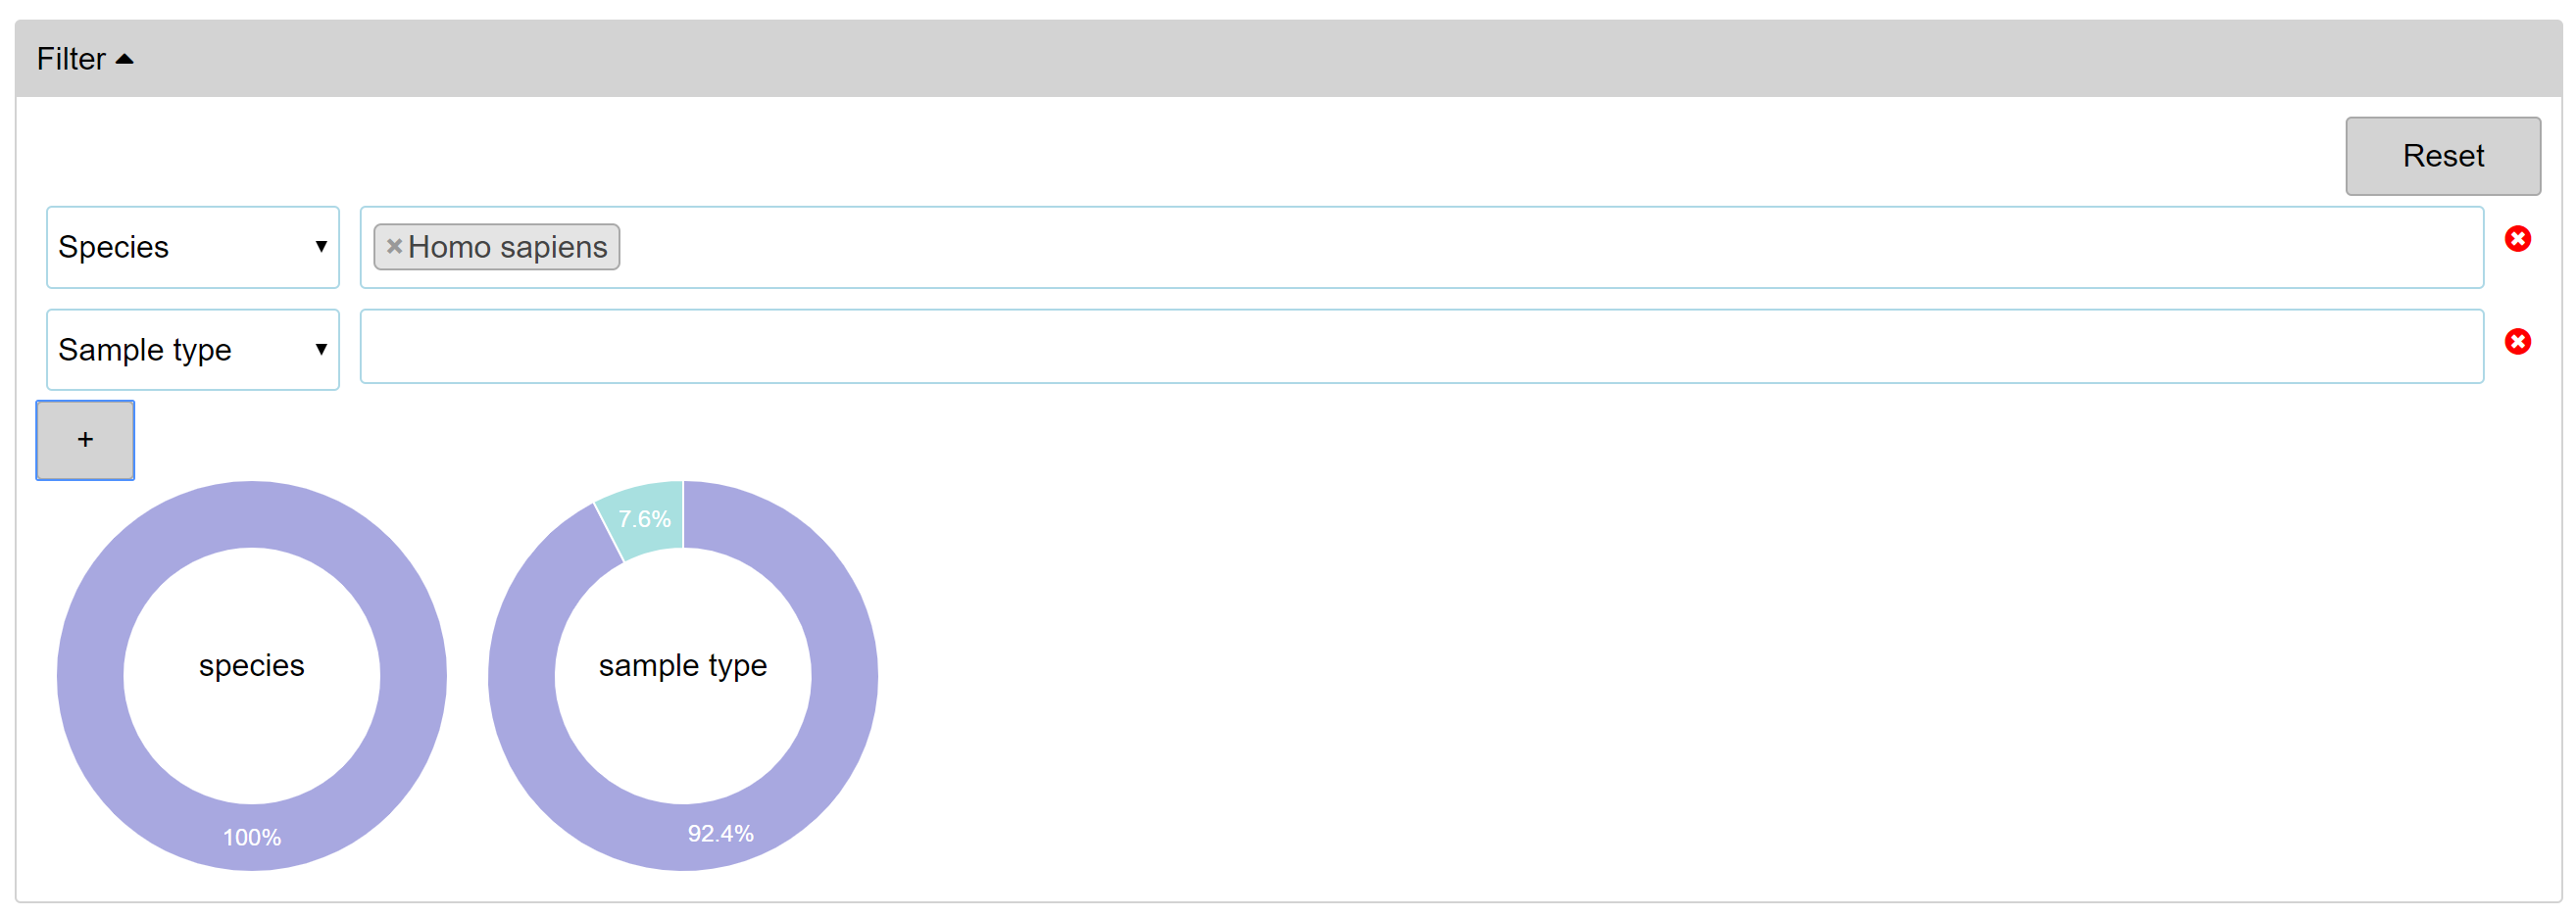
- Filtering 'Globe'
-
- Curated metadata such as species, sample types and cell lines are provided for filtering Globe, the whole dataset union, as well as simple keyword search.
- Pie charts on the right can be used for specifying species and disease metadata, just by clicking the target.
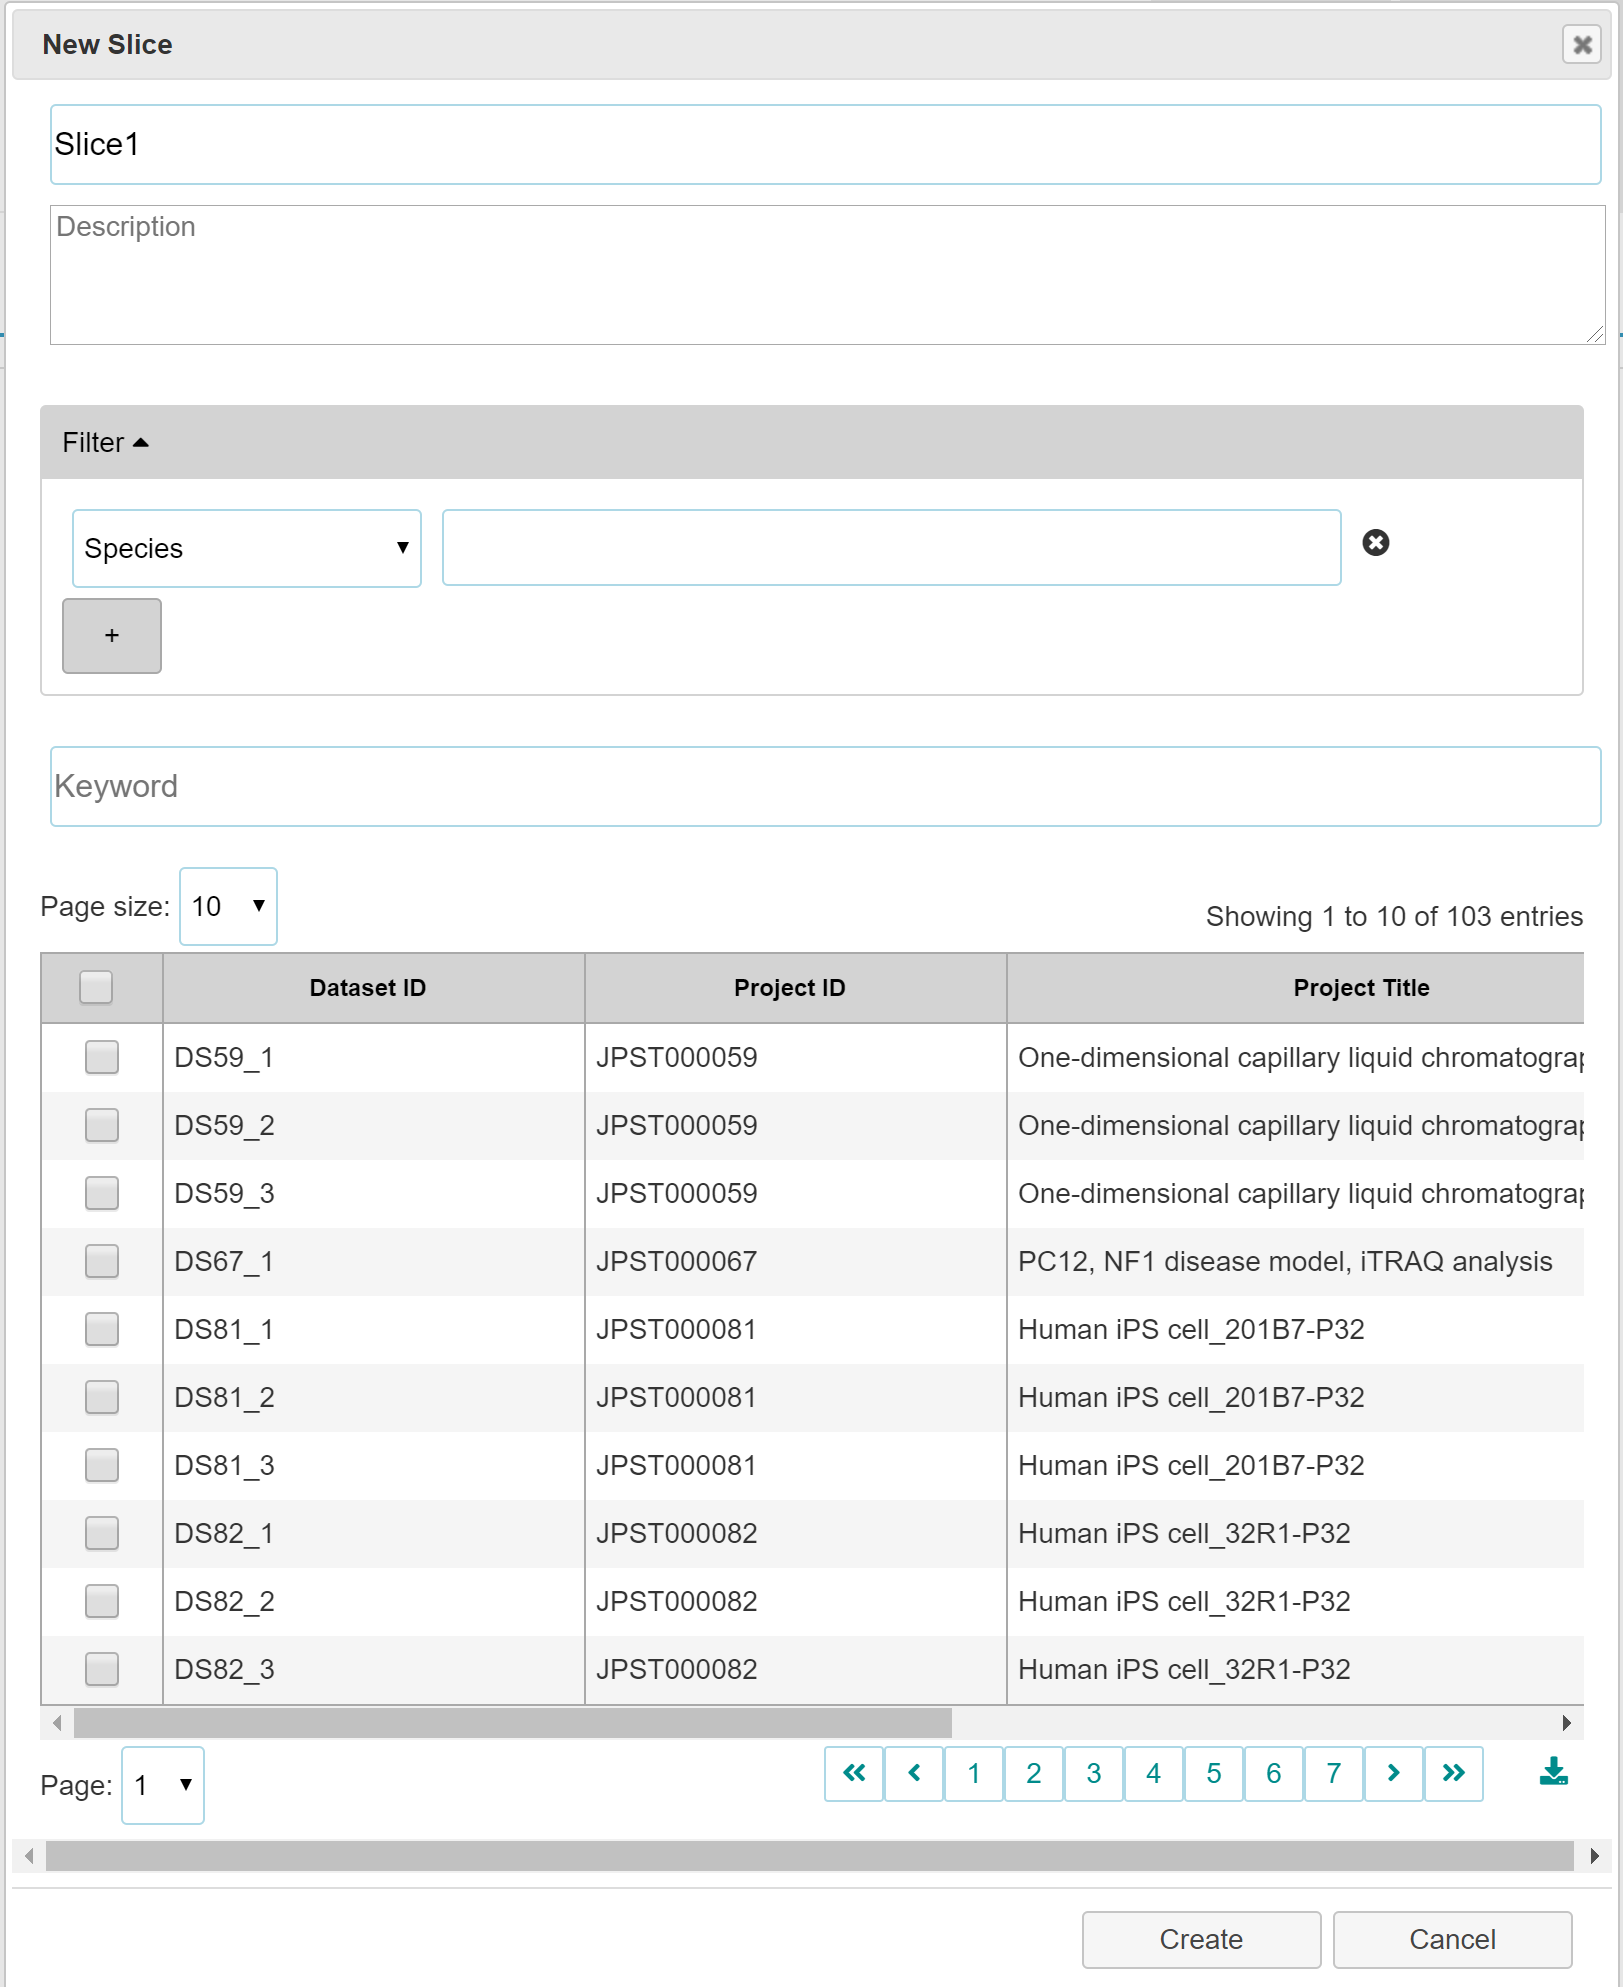
- How to make 'Slice'
-
- Click "New Slice" button in the Serch tab or "+" button in the Slice tab.
- Select check box(es) your interested dataset(s).
- Click "Create" button.
- Because the Slice data is stored in WebStorage of your browser, your data is never leaked to the Internet. The different browser in your computer does not share WebStorage. So, you need to export and import the Slice to observe the same datasets in the different location (the different browser).
- Comparing Slices
-
- Two selected slices can be compared for statistical and functional analyses.
- The details are described below.
Information pages for dataset, slice and protein
- Dataset and slice pages consists of "Chromosome Info", "Protein Existence" and "KEGG Pathway Mapping", whereas protein pages consists of "Protein Browser" and "Peptide sharing".
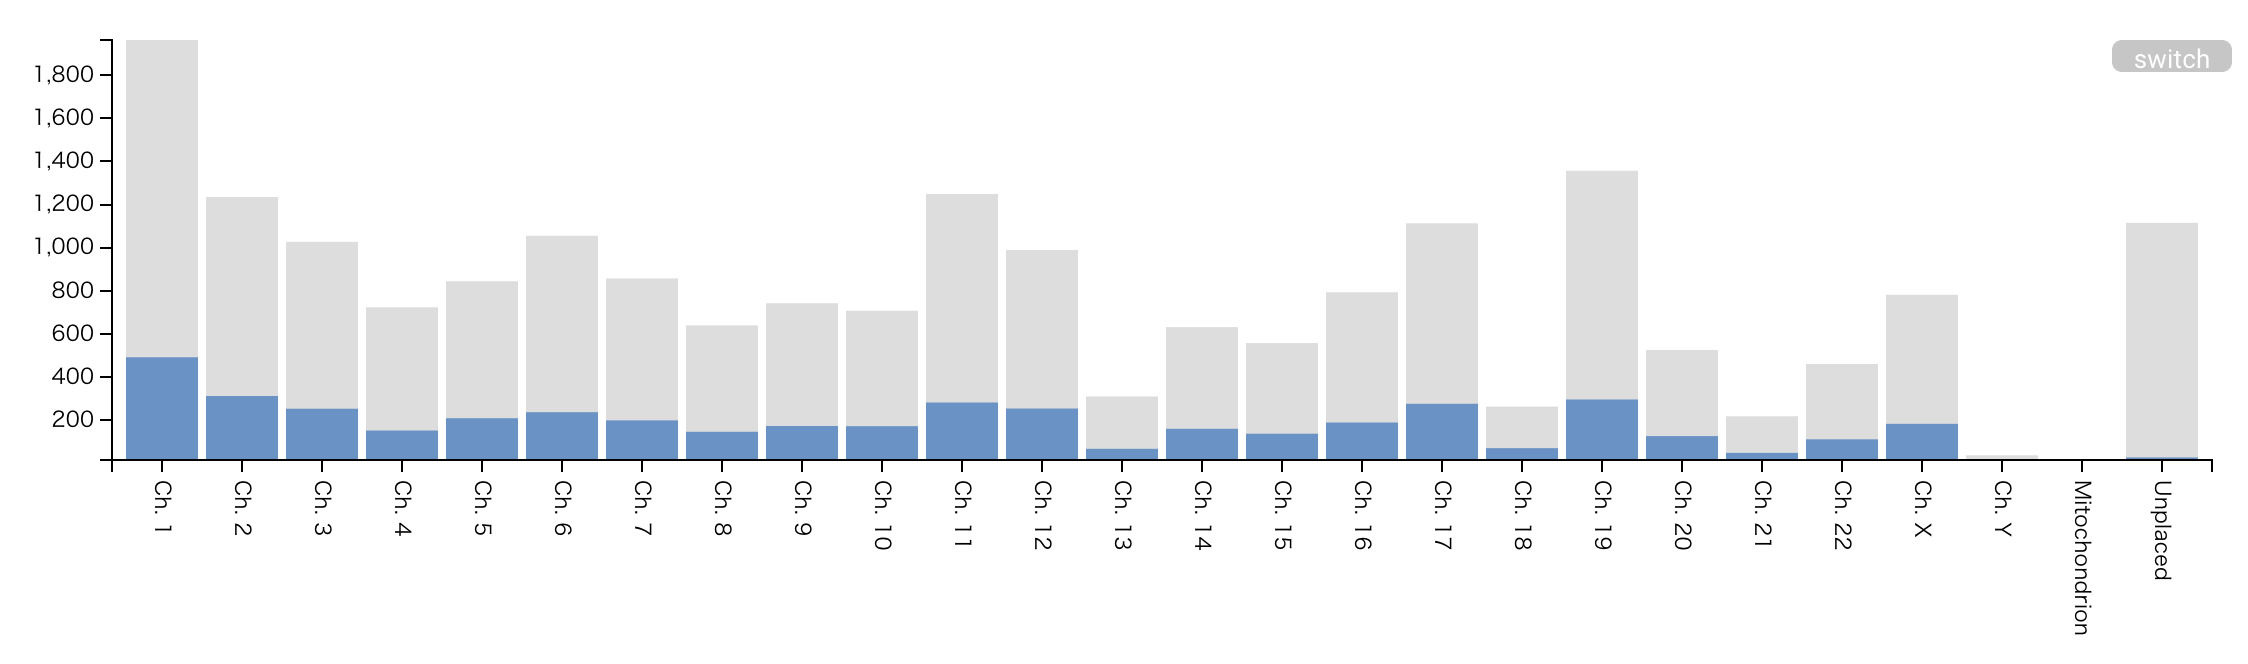
Chromosome Info.
- Histogram of detected leading proteins (blue) and the total number of proteins (gray) per chromosome, mitochondria and plasmid. The protein count is based on the count of UniProt entry (therefore, the total number of proteins doesn’t mean the exact number of coding genes in each chromosome). In human dataset, the protein count is based on the count of neXtProt entry.
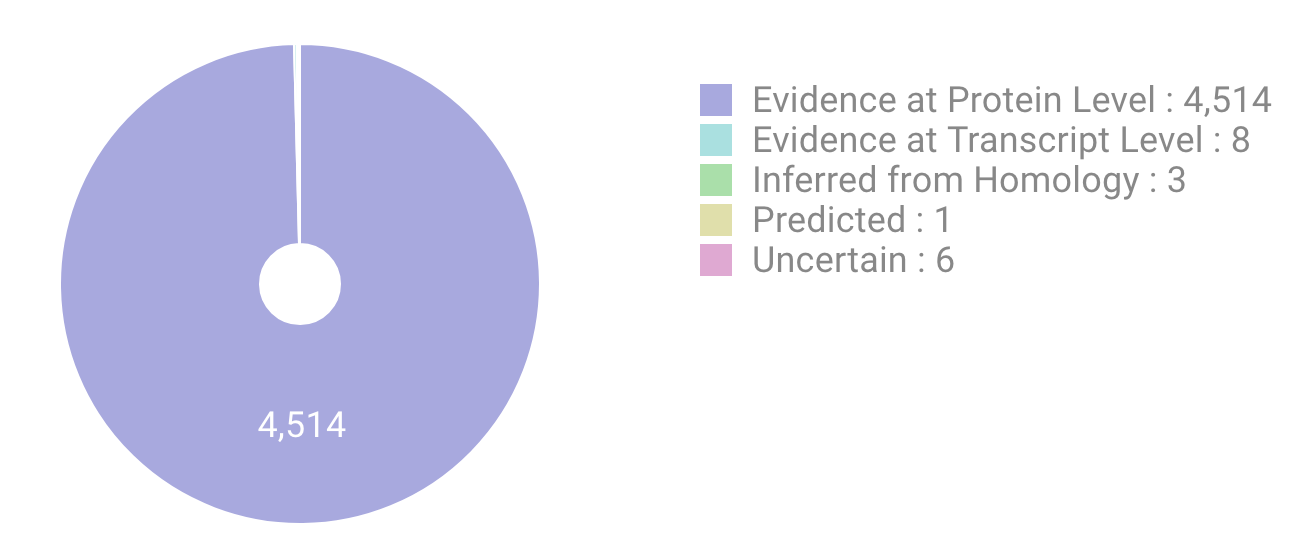
Protein Existence
- Pie chart of the evidence types that supports existence of proteins, described in neXtProt database (for human) and UniProt database (for others).
-
- (ref. uniprot:protein_existence)
- Proteins classified as each evidence type are listed by using pulldown menu or clickable legend/chart.
KEGG Pathway Mapping
- Proteins with KEGG Orthology (KO) annotation can be mapped to KEGG pathway. The protein box color of pathway maps varies red to blue (red and blue show high and low expressions, respectively, based on their spectral counts).
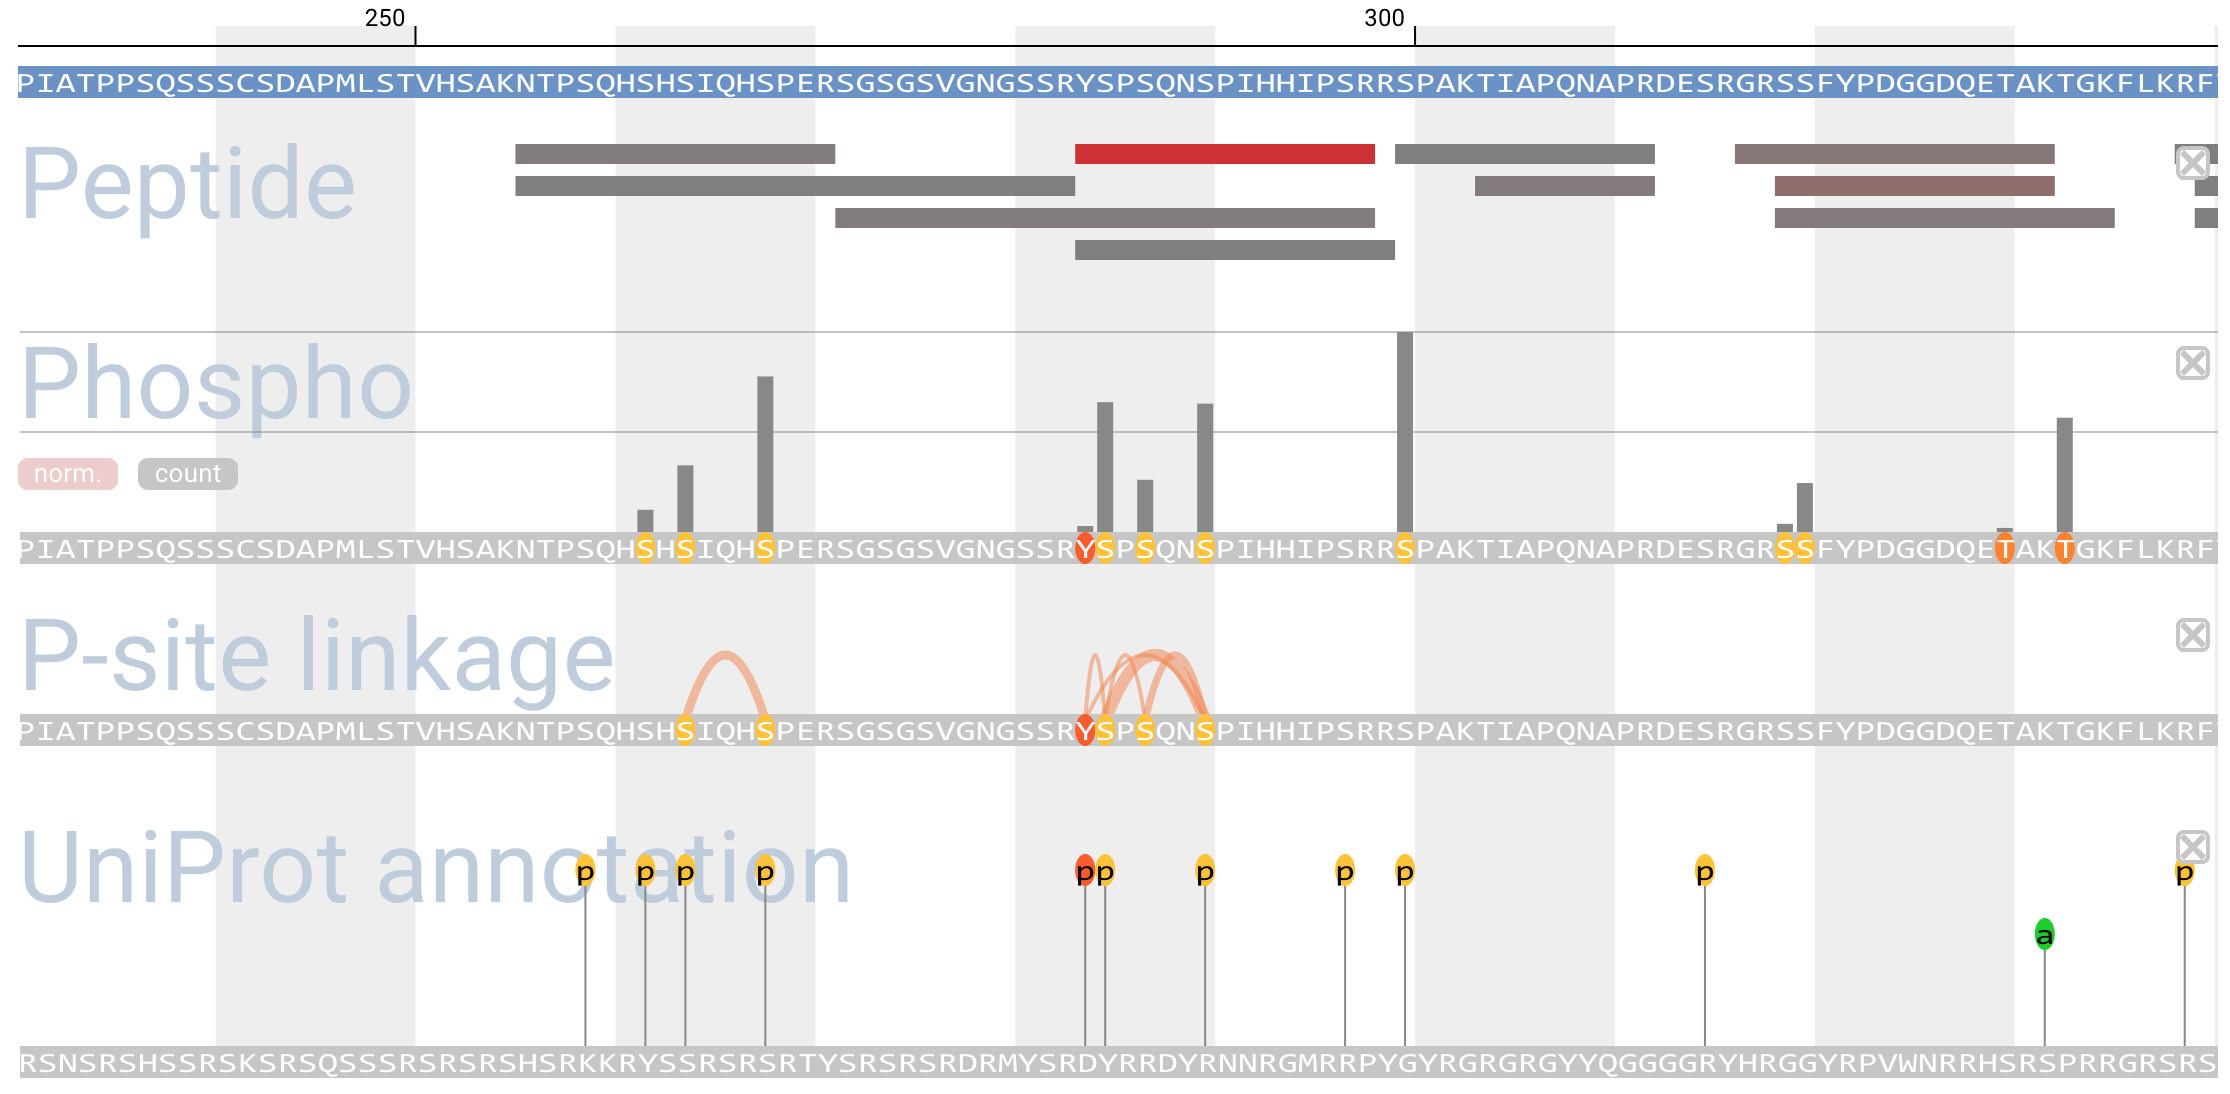
Protein Browser
- Protein browser is a viewer of protein annotations. Users can add interest annotations into the viewer panel from pulldown menu.
-
- 'Peptide alignment' shows detected peptides mapping to protein sequence. The color of peptide bars reflects the number of PSM, and varies red to gray (red shows high and gray shows low).
- 'PTM site' shows detected PTMs on protein sequence. The vertical bar length above the site reflects the count of PTM detection. ' norm.' shows normalized length by spectral counts including the site, and "count" shows real counts.
- 'P-site linkage' shows co-occurrence of phosphorylation sites on a peptide.
- 'UniProt annotation' shows PTM sites and single amino acid variations described in UniProt.
-
- zoom in/out with wheel/touchpad scroll
- horizontal move with drag
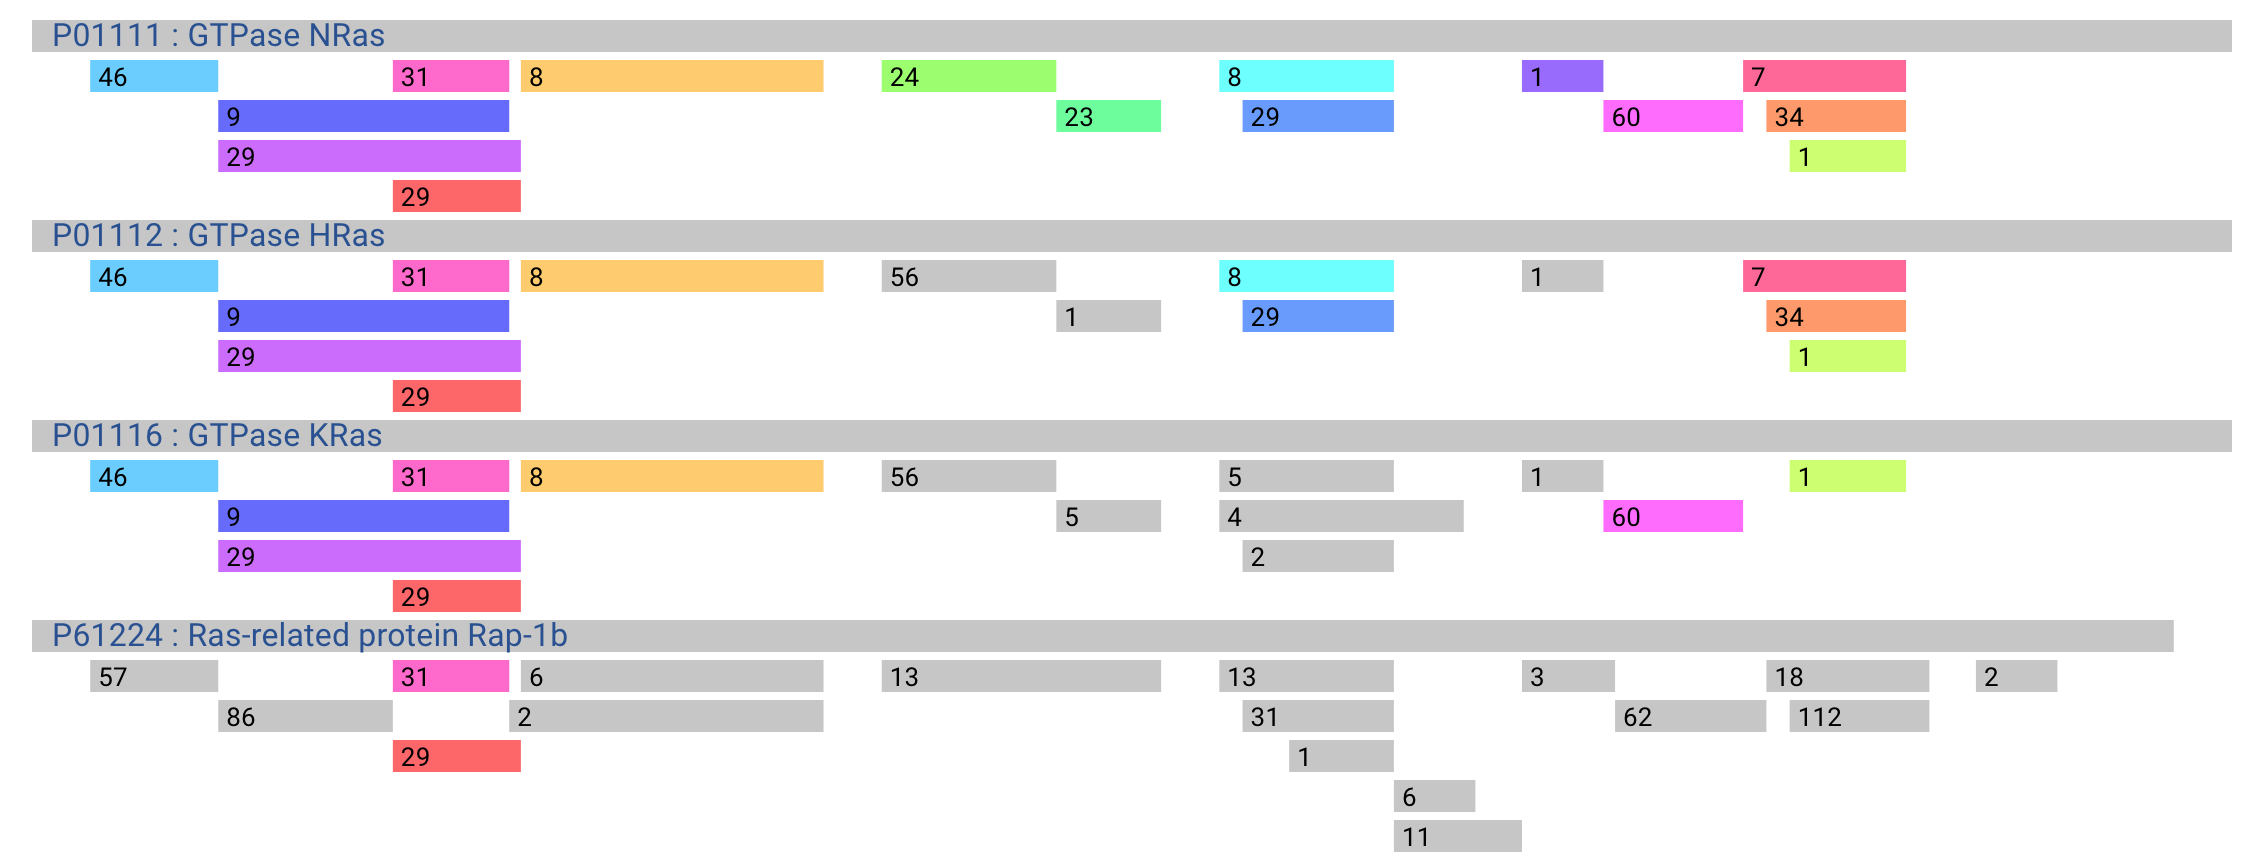
Peptide Sharing
- Peptide sharing shows shared peptides mapping to multiple proteins. The same color of peptide bars means the same peptides. Numeric values over a peptide bar is the number of PSM. Users can switch the display with six buttons below the alignments.
-
- name: switch visible/invisible of protein names
- color: switch coloring: i) Peptides only mapped to reference protein (top protein) are colored, and other peptides are colored by gray. ii) All peptides are colored.
- trypsin: show the cleavage site by trypsin on protein sequences. Un-tryptic peptides are colored to gray.
- exon: show the boundary of exons on protein sequences
- guide: show guide line
- edit: remove the protein user do not need
-
- zoom in/out with wheel/touchpad scroll
- horizontal move with drag
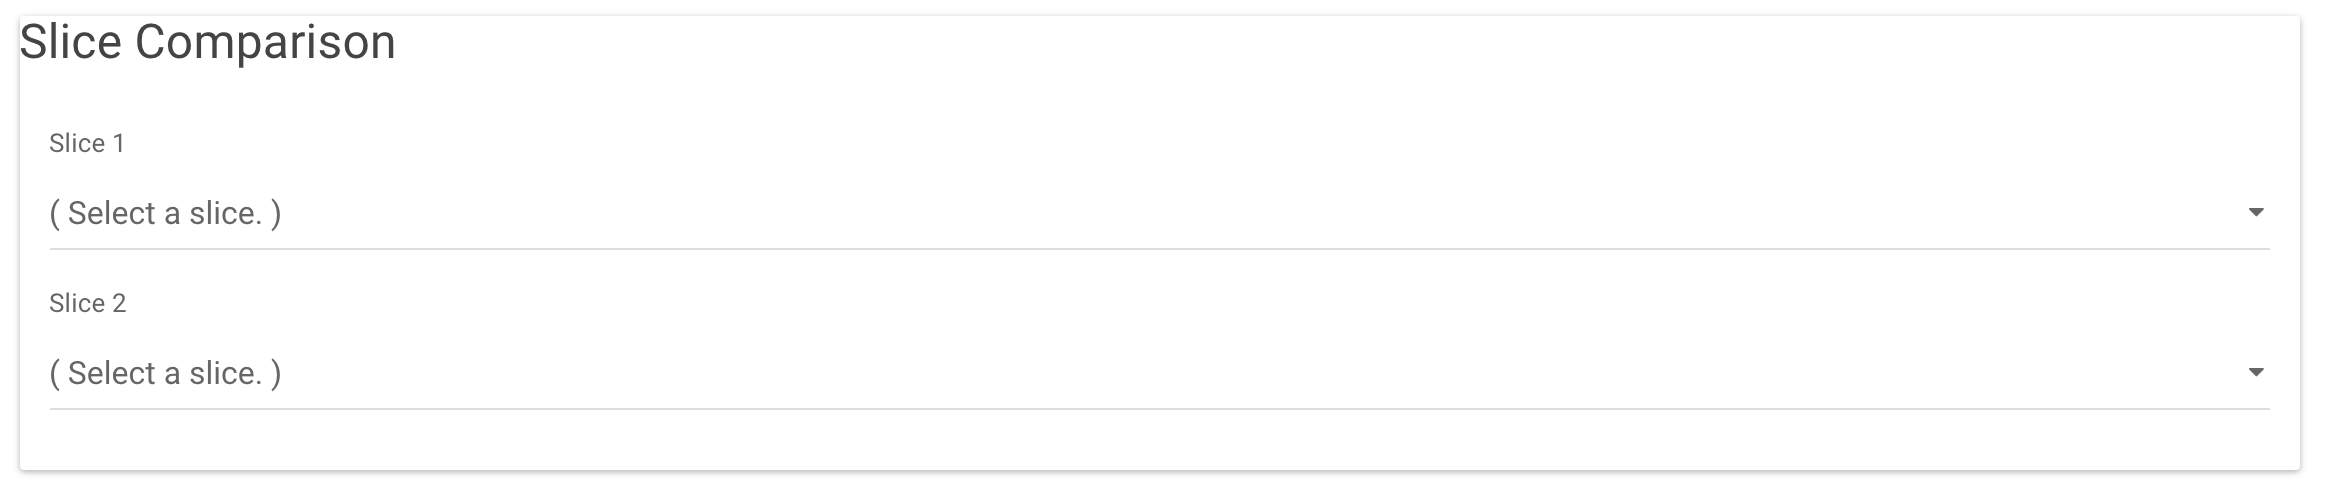
Slice comparison
- Users can compare two slices by selecting Slices from pulldown menu.
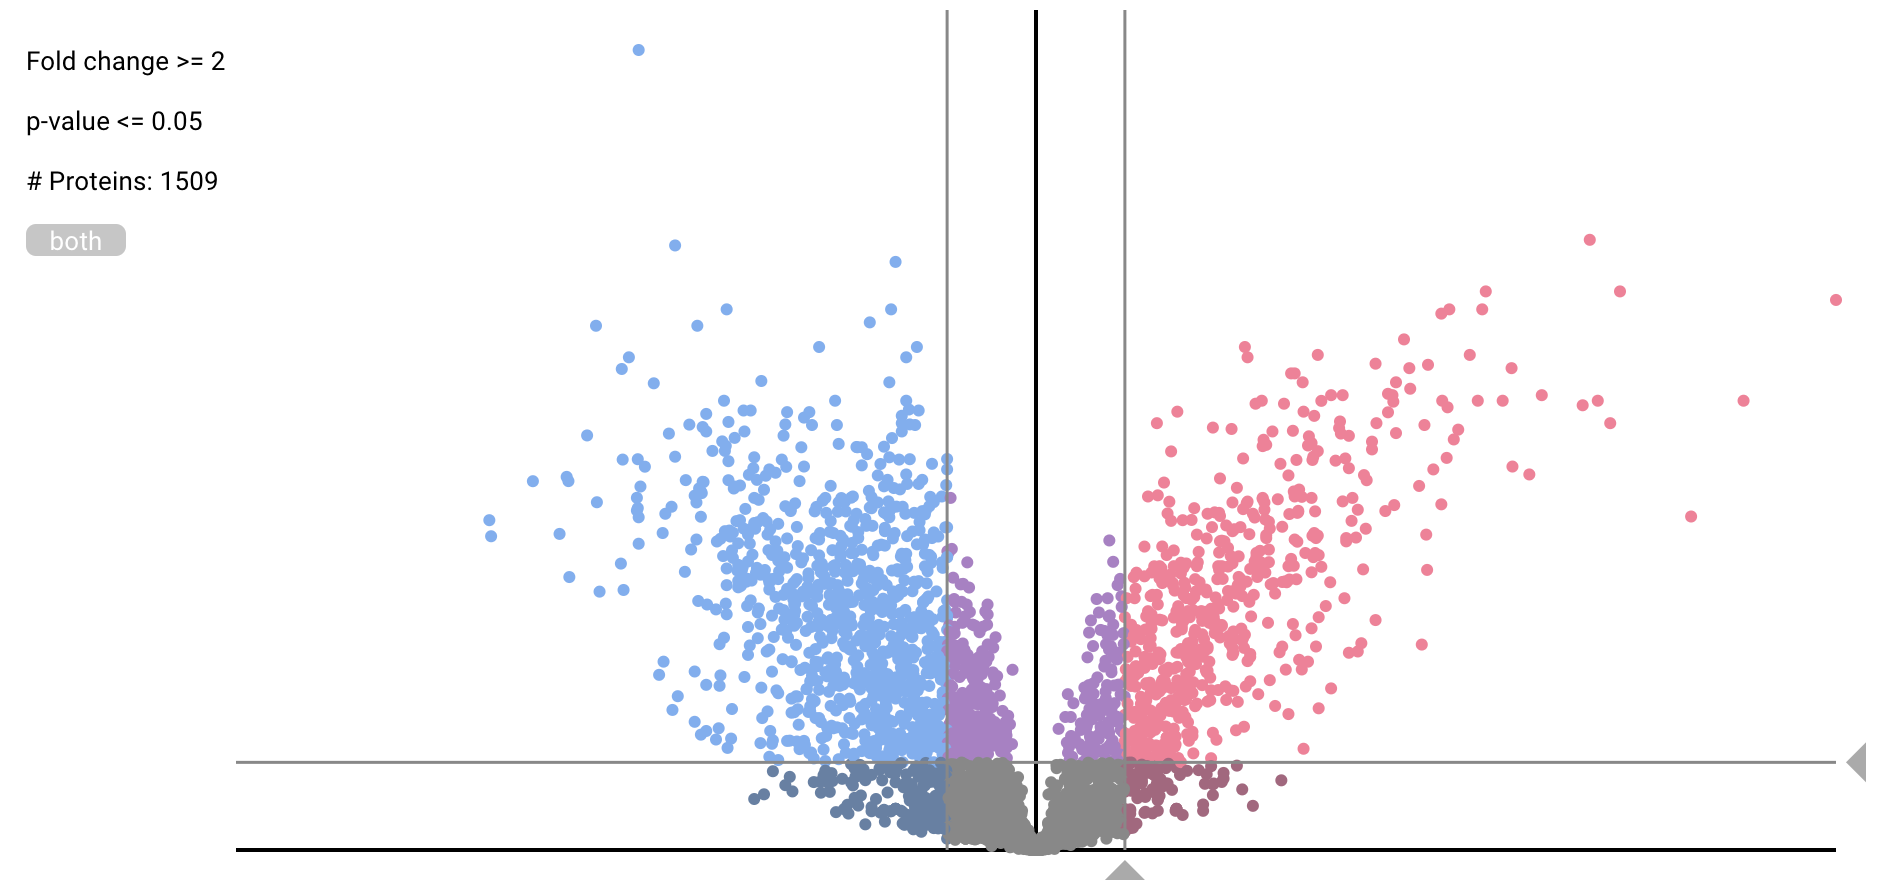
Differential Expression Analysis
- User can compare the expression level of proteins between two Slices by empirical Bayes estimate, Wilcoxon rank sum test and fold change of average from the pulldown menu. The quantification is based on spectral counting.
- The former two methods use R programming language library. These methods need at least 2 datasets in either Slice. In the volcano plot, users can change thresholds of the fold change and p-value by moving the triangle marker on x- and y-axis.
- The fold change of average expression level in a protein is shown as histogram like plot. Any statistical test is not applied, so p-value is not calculated. The y-axis shows pseudo frequency and has strictly little meaning.
-
- move threshold bars with drag of triangle markers
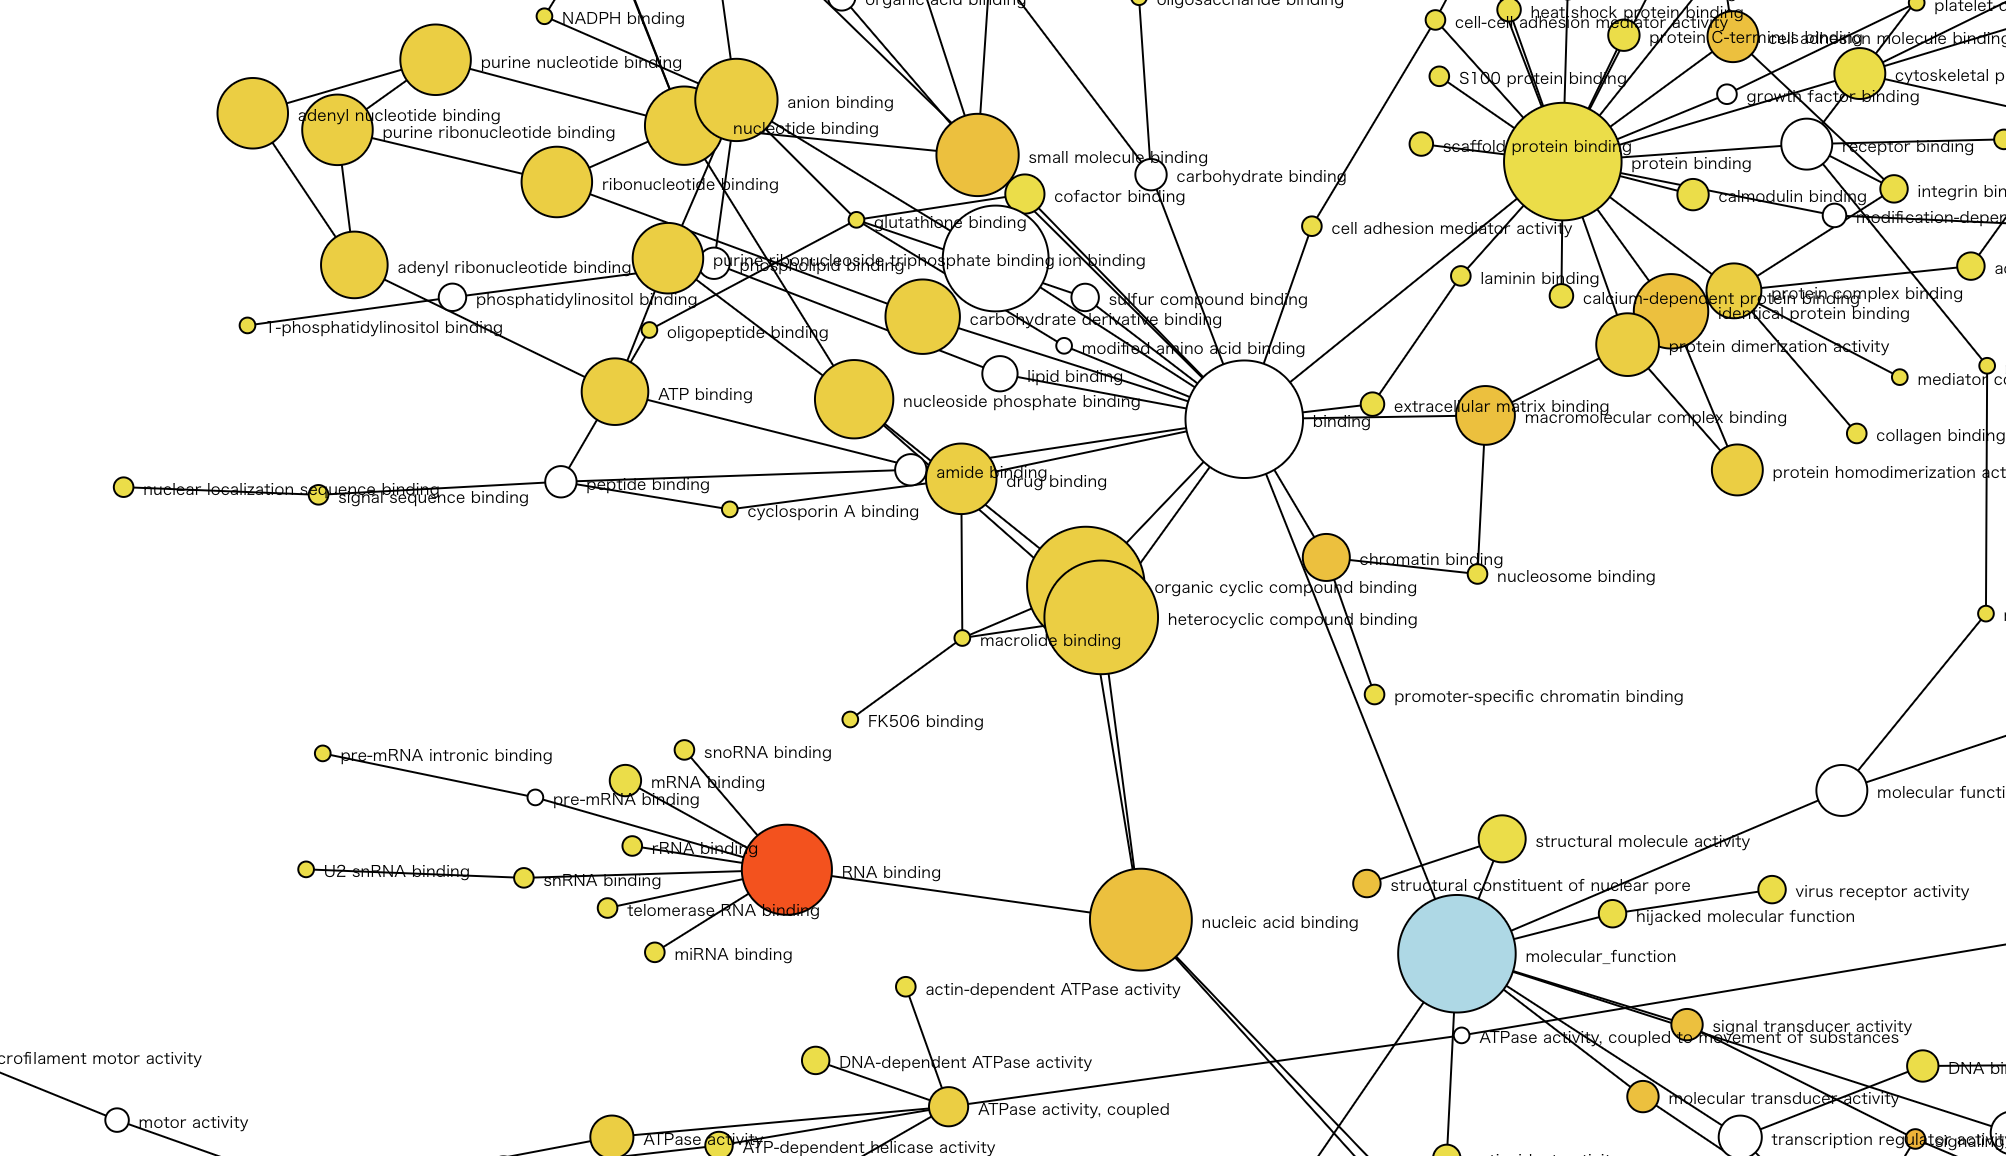
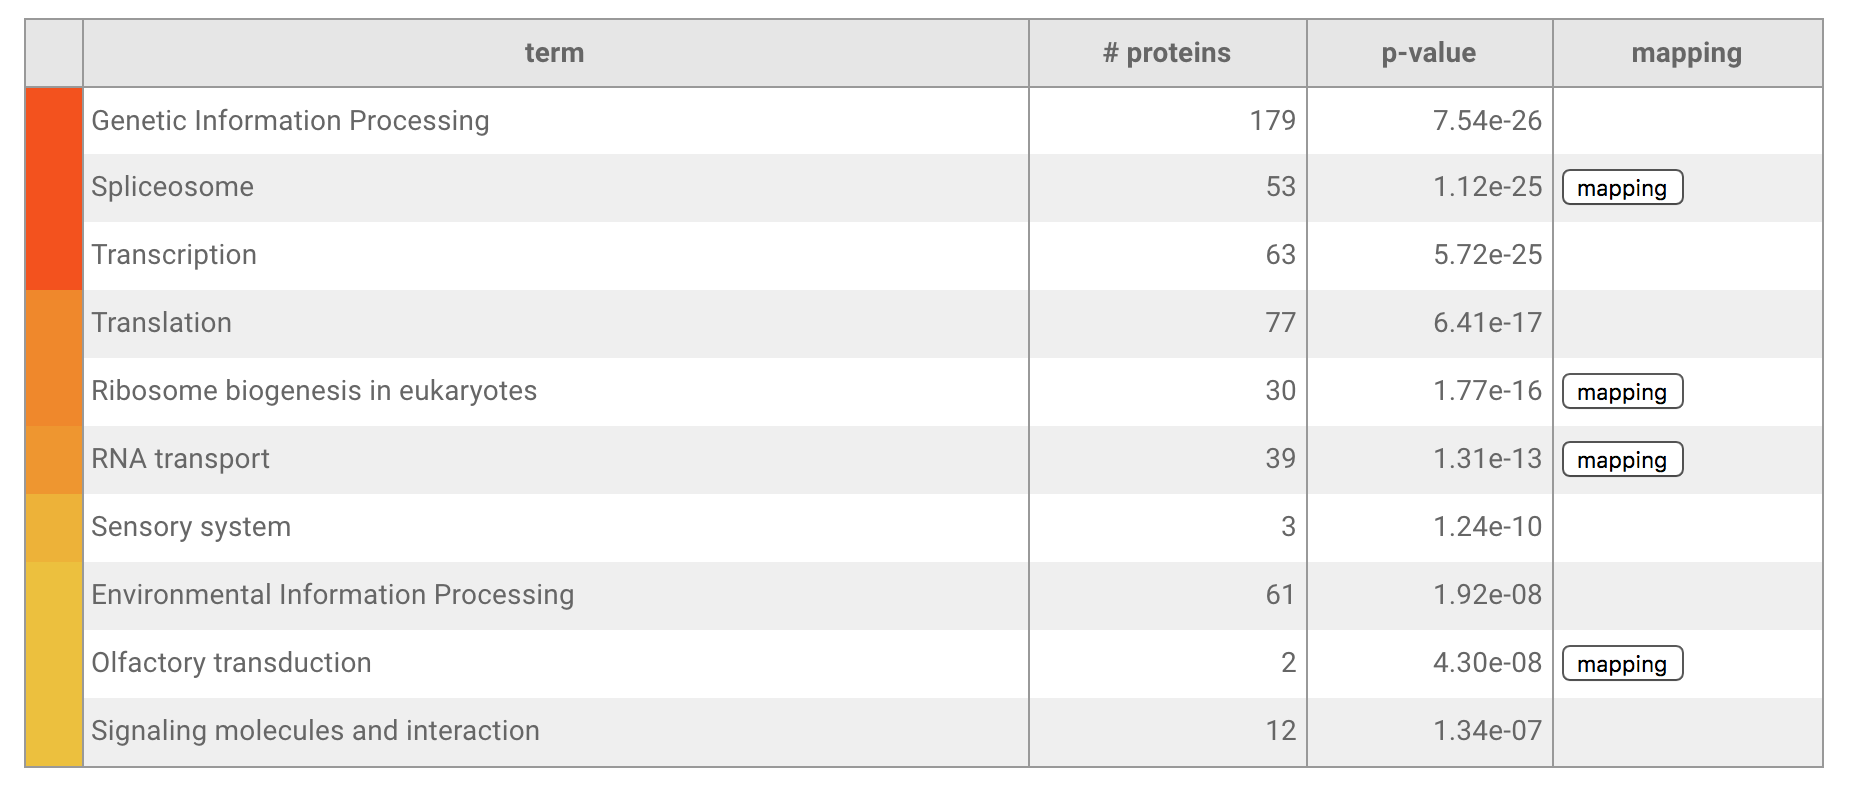
Enrichment Analysis
- Protein set enrichment analysis for selected proteins in the differential expression analysis. Users can select a target from KEGG pathway category and three categories of Gene Ontology (GO) (biological process, molecular function and cellular component).
- The result is displayed by a network graph and a table. Nodes in the network show categories of KEGG or GO, and node color of enriched category varies yellow to red (p-value < 0.05, yellow shows high and red shows low). The blue node shows root category of network. Each node size reflects the number of selected proteins in the differential expression analysis. However, the size of white node and root node is limited up to the maximum size of enriched nodes colored from yellow to red to make network layout clearer.
-
- zoom in/out with wheel/touchpad scroll
- move with drag
- When the target is the KEGG pathway, users can map proteins to KEGG pathway map. The boxes of maps are colored blue to red (blue shows expression level is decrease and red shows increase). When a box corresponds to multiple proteins, box color reflects any one of proteins (It is a restriction of the KEGG mapper).
Vocabularies
- Database
-
- Globe: Accumulated results of re-analyses for raw data. All datasets in the jPOSTdb.
- Slice: A dataset group which is the result filtered by meta-data from the globe database. Or a dataset group which merged several filtering results.
- Protein type
-
- Leading protein: The representative protein in a protein group. (ref. PSI-MS_1002401)
- Spectrum same-set protein: The protein which matched same-set of spectrum (same-set of PSM) of a leading protein. (ref. PSI-MS_1001595)
- Spectrum sub-set protein: The protein which matched sub-set spectrum of a leading protein. (ref. PSI-MS_1001597)
- Spectrum subsumable protein: The protein of which spectrum are across two or more leading proteins. (ref. PSI-MS_1001599)
- Peptide type
-
- Shared peptide: The peptide exists in multiple proteins. This is not unique peptide, clearly.
- Unique peptide: The peptide exists in only one protein.
-
- Shared peptide at MS level: The peptide exists in multiple proteins, when leucine and isoleucine are not distinguished. This is unique peptide at amino acid level but not unique at result of MS.
- Unique peptide at MS level: The peptide exists in only one protein, even when leucine and isoleucine are not distinguished. This is unique peptide, clearly.
Reference
- The jPOST environment: an integrated proteomics data repository and database
Yuki Moriya, Shin Kawano, Shujiro Okuda, Yu Watanabe, Masaki Matsumoto, Tomoyo Takami, Daiki Kobayashi, Yoshinori Yamanouchi, Norie Araki, Akiyasu C. Yoshizawa, Tsuyoshi Tabata, Mio Iwasaki, Naoyuki Sugiyama, Satoshi Tanaka, Susumu Goto, Yasushi Ishihama
Nucl. Acids Res. 47 (D1). doi: 10.1093/nar/gky899